

This is an ancient method of chart analysis. Using Candlestick we can visually analyse whether the Bulls or the Bears are winning? There are different types of Candlesticks patterns help us to know whether the bulls or bears are in control.
It is important for any technical analyst in the stock market to understand the the price action using Candlestick patterns for interpretation of market movement.
Candlestick and Its History
The Candlestick charts are developed in the 1700s by a Japanese rice trader known as Munehisa Homma. Homma discovered that as there was a link between price and the supply and demand of rice, the markets were also strongly influenced by the emotions of traders. They were introduced to the Western world by Steve Nison in his book Japanese Candlestick Charting Techniques, first published in 1991.
For More about Candlestick History
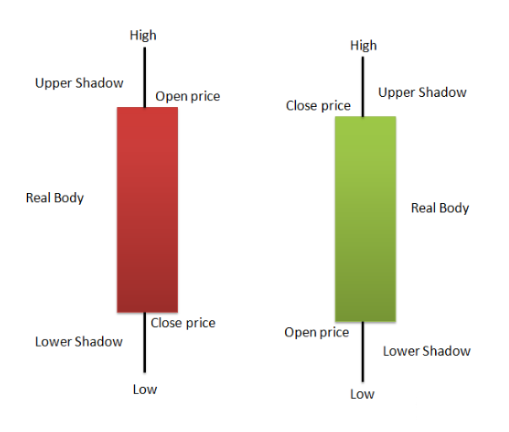
By looking at a candlestick, one can identify an asset’s opening and closing prices, highs and lows, and overall range for a specific time frame. Open, High, Low, and Close (OHLC) of Candlestick bars makes them more useful.
The Anatomy of Candlestick
- A Candlesticks consist of Body and Wick or Shadow. The colour of body represents the direction of market movement – a green body indicates a price increase, while a red body shows a price decrease. Generally, the longer the body of the candle, the more intense the trading.
- The thin vertical black lines above and below the real body are known as the wicks or shadows. The top point of upper shadow shows the high price, and lower point of down shadow shows the low prices reached during the trading session.

Each candle on daily timeframe captures a full day’s story about worth of news, data, and price action etc. So Traditionally, candlesticks are best used on a daily basis. Over time, Different candlesticks patterns are used by traders to recognise major support and resistance levels of the asset.
Important Candlestick Patterns For Day Trading
There are Four types of candlestick patterns:
- Continuation Patterns
- Bullish Reversal Patterns
- Bearish Reversal Patterns
- Neutral Pattern
List of different Types of Candles in the stock market which are usefull in Trading and technical analysis:
Hammer Pattern
- This is a reversal pattern. It suggest end of directional sentiment
- The hammer is produced when a candle has a very short body and leaves a long shadow.
- According to “An Empirical Evaluation of the Performance of Technical Analysis” by Brett N. Steenbarger, published in the Journal of Futures Markets, the hammer candlestick pattern has a success rate of approximately 62% in predicting bullish reversals.
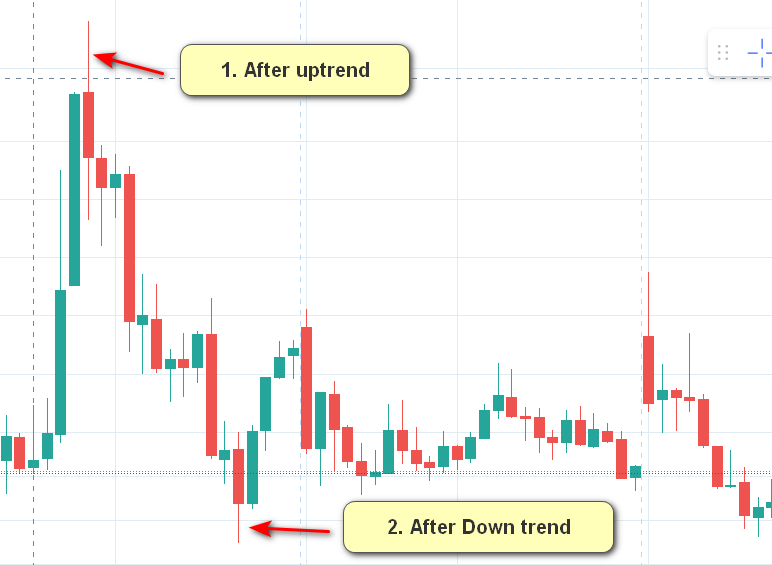

Example of Hammer pattern:
- After continuous bullish rally at top hammer pattern formed and then price falls from that level.
- Similarly After continuous down fall hammer pattern created at base and price reversed from that level.
Engulfing Pattern
- This is a reversal pattern. In this pattern current candle completely engulfs the previous candle.
- There are two types of Engulfing pattern those are Bullish Engulfing and Bearish Engulfing pattern
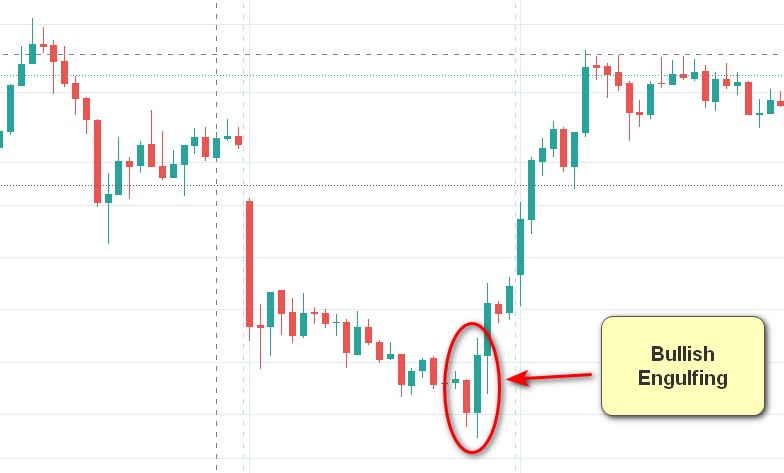
- Bullish Engulfing Pattern consists of a small bearish candlestick followed by a larger bullish candlestick that completely engulfs the previous one suggesting potential up move. This pattern formed after a up trend move.
- Similarly
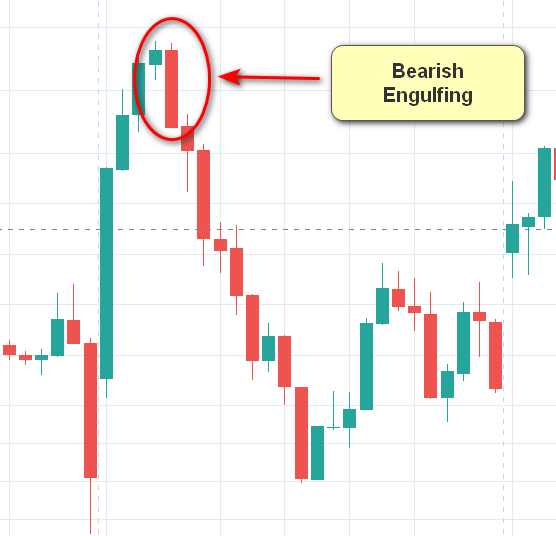
- Bearish Engulfing Pattern consists of a small Bullish candlestick followed by a larger bearish candlestick that completely engulfs the previous one suggesting potential down move. This pattern formed after a down trend move.
Example of Bullish Engulfing and Bearish Engulfing Pattern


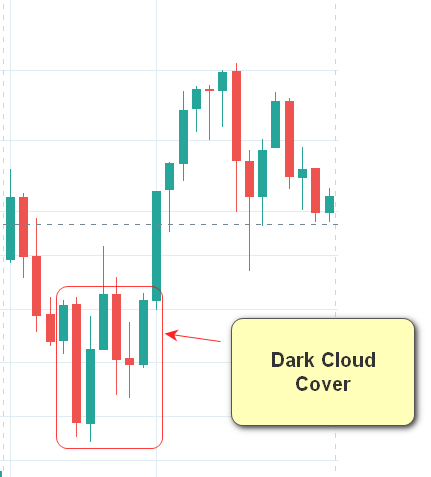
Dark Cloud Cover
- This candlestick pattern indicates potential bearish reversal.
- This pattern formed at support level after a bearish trend signaling that the bulls have taken over the session.
- It comprises of many candles.
- The initial bearish candle represents the continuation of the downtrend, but the subsequent bullish candle that opens above the previous low and closes above the midpoint of the bearish candle suggests a strong support of the bullish momentum.
- This pattern indicates a potential reversal of the uptrend.
- According to a study conducted by the Technical Analysis Research & Education (TARE) Foundation, published in their report titled “Evaluating the Effectiveness of Candlestick Patterns in Modern Markets,” the Dark Cloud Cover pattern has a success rate of approximately 65% in predicting bearish reversals.
Example of Dark Cloud Cover

Following Types assets can be traded using Candlestick Patterns
- Stocks: Individual company shares.
- Forex: Currency pairs like EUR/USD, GBP/JPY.
- Commodities: Gold, silver, crude oil, natural gas etc
- Indices: Stock market indices like NIFTY, BankNifty etc.
- Cryptocurrencies: Bitcoin, Ethereum, and other digital assets.
- Futures and Options: Derivatives Market to various underlying assets.
- ETFs: Exchange-Traded Funds.
Conclusion
- Candlestick patterns are most effective in trending market.
- In choppy or sideways markets, where prices move within a range, candlestick patterns might give false signals and less reliable
- Combine candlestick with other technical indicators like Relative Strength Index, Moving Average, VWAP etc.
- Best time frame depends upon individuals trading style


1 thought on “Most Important Candlestick Patterns For Day Trading”
Thanks…Very helpful in trading